

DISCLAIMER: I like writing about stuff that I’m actively learning about. Unless I explicitly state so, I DO NOT claim any kind of expertise. I write because I want to deepen my knowledge and because I hope someone might find it useful. If you are looking for expert-level article, you will be dissapointed.
There is a book called “The man who mistook his wife for a hat”. I never read it, but I loved the title. It was written by a neurologist and it talks about strange and unique cases of people suffering from various rare conditions, one of them being “visual agnosia”, a condition where you can identify separate features of an object, but can’t understand them as a whole. This case served as a book title, given that on eof his patients (allegedly) really mistook his wife’s head for a hat.
What does this have to do with this article? Well, everything; and nothing. This one is a story where the main character (myself) started going delusional in an attempt to uncover the mysterious behavior of his debugger. The main character (myself) could explain how specifics worked, but he couldn’t discern how it all works as a whole, which started driving him mad, believing that the debugger has conspired against him, and leading him to a mission of finding the answers which resulted in this article. Worry not, the answers were found and the mystery was resolved; and there was no conspiracy made by debuggers. The story is, however, interesting, so let’s jump into it.
NOTE: If you want to skip to the “resolution” and get a short answer on how it really works, feel free to scroll all the way down to “Epilogue”. Everything in between here and the Epilogue is really just an amusing story but nothing more than that.
Prolog: How do breakpoints work?
Have you ever actually sat down and thought about what happens when you place a breakpoint on the specific line? I haven’t. And I’d presume many others didn’t. You just know it will work and that’s where the interest ends. There are cases where debugger will warn you that it can’t break at the line you selected, but if it does set the breakpoint, you confidently expect it to be hit. Cool.
My assumption was rather simple – what’s likely happening is that, when you attach the debugger, OS sends each and every CPU instruction to debugger’s engine, and debugger decides whether to pause the execution or let the instruction execute. Makes sense. It would surely be slower than without a debugger, but hey, who expects that their app would run at the same speed with debugger attached, right? It made perfect sense.
Nope. Hard NO. Like, “could you be any more wrong than that” kind of wrong.
Turns out it’s actually way simpler than that. And way more amusing really. What really happens is that, when you place a breakpoint, what debugger does is that it replaces the original instruction with a “special” one. That special instruction would cause CPU to raise an exception and if debugger is attached, it catches it and pauses the execution so that you can inspect the state of your process. Once you want to proceed, the debugger returns back the original instruction and lets CPU execute it as if nothing happened. Makes sense. And these are called “software breakpoints”, because you are using software to mingle with original instructions. There are also hardware breakpoints which rely on writing stuff directly to CPU’s debug registers, but we’ll get to that. I want to focus on Software Breakpoints for now.
On x86 architectures, this special instruction is “INT3“. The opcode for this instruction is 0xCC.
So what happens when you place a breakpoint on a specific line is that debugger will locate the proper instruction, replace it’s content with 0xCC and then wait for CPU to hit it. Once it gets hit, your OS propagates the first-chance exception to your debugger and you get the rest. Great! And quite cool btw!
Logically, I expected to see this in actual process’ memory, so I eagerly fired up the WinDbg and planned to spend no more than 5mins on this. Who’d know it’ll turn into a week-long struggle and a blog post.
Chapter One: Lies, damn lies and WinDbg
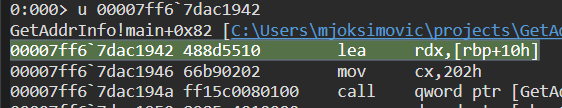
If placing a breakpoint causes the original instruction to be replaced with 0xCC, then I should be able to see it in debugger. So, I located this line without a breakpoint, and jotted down the original instruction: 0x488d5510.
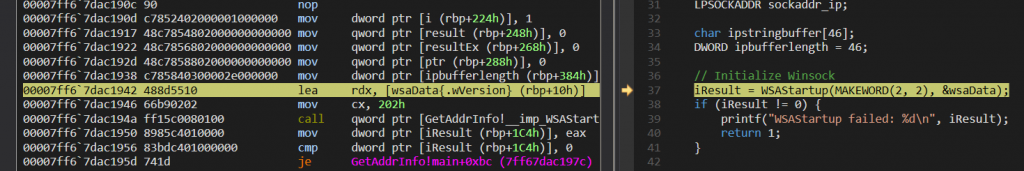
This should turn into 0xCC once the breakpoint is set, right?
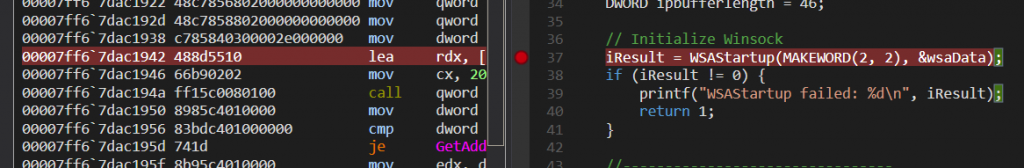
Nope. The breakpoint is there, but the instruction remains unchanged. It’s still 0x488d5510. Interesting. But in a way, I guess it makes some sense. As a typical user, I’d always expect to see the original instruction, rather then the one modified to trigger a break. I guess it makes sense that the Disassembler view still shows the original.
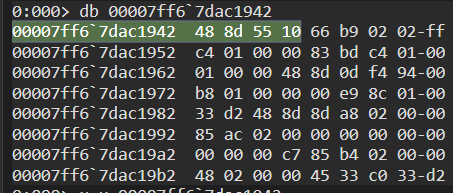
What if I peek at content at that exact memory address, it will surely show that there’s 0xCC there, right?
Nope. Displaying bytes from that exact address still shows the original instruction. What about “unassemble” (u)?
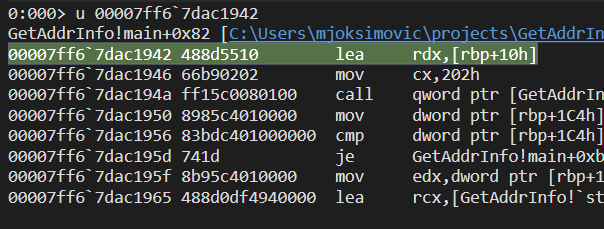
Still a no. Urgh.
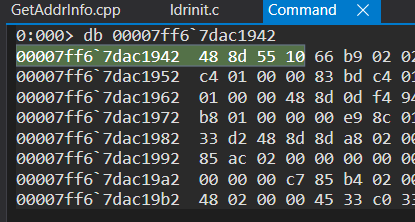
Okay, so I presume that WinDbg is trying to be smart and assuming that I want to see the original stuff. Makes sense. But raw memory view shouldn’t lie, right? Let’s see:
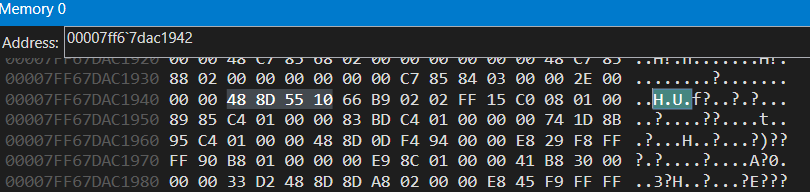
And it’s a NO. Again. Well what in the actual f*ck?! Is WinDbg using something other than 0xCC? Is it doing some black undocumented magic? Urgh.
I did some binging around and came around this amazing article. This guy claims that WinDbg is definitely using 0xCC (i.e. INT3) for software breakpoints. And he seems to uncover the mystery here. Namely, he claims that “WinDbg is lying to you” and “refusing to show what really is there”. That makes sense really. WinDbg is showing you what’s useful, and what’s useful is the original instruction that will be executed and not the modified one. Good. But, I still should be able to see the modified one somewhere, right? I mean, if WinDbg is lying, that means that the 0xCC is in fact there, but it’s just not visible. So trying to read that memory from another place should do the trick, right? Let’s see.
Chapter Two: Non-invasive attach to the rescue
If your main debugger is purposefully lying to you, then attaching a second debugger (in a non-invasive mode) should do the trick, right? Makes perfect sense. The second debugger would have no clue about the lies and even if it did, it wouldn’t know where to read the original instruction from. Makes sense and sounds like a plan.
So I fire up another instance of WinDbg, I attach to the process in non-invasive mode, and I read that same memory from there:
Well, shit. It’s a NO again.
I get that my primary debugger is lying, but how in the world is the second instance of debugger lying as well? WTF? Is this some grand WinDbg conspiracy? Do they unite together to mess with the user, knowing how to tell perfect lies? Does each and every instance of WinDbg see 0xCC and figures out that there’s probably alternate instruction there, and then goes to load it from who-knows-where and serves it to user? It most certainly seems so! Or else, the only plausible explanation is that … that WinDbg is NOT using 0xCC and INT3 … After all, the article where I read about WinDbg’s lies is like more than a decade old. What if things changed since then? Maybe it USED to lie, but now it’s doing something different. F*CK!
I accepted the defeat and went to bed. Tough night it was and not much sleep was involved. But in that limbo between sleep and being awake, I gave birth to yet another idea – what if WinDbg is smart enough so that it uses Hardware breakpoints first? Time to check that.
Chapter Three: Could it be Hardware?
What if WinDbg is actually being smart and what if it relies on hardware breakpoints in cases where there are just a few of them defined? Maybe it’s some optimization technique to offload the number of overwritten instructions or whatever. Sounds like it could be the potential culprit so I excitedly checked it:
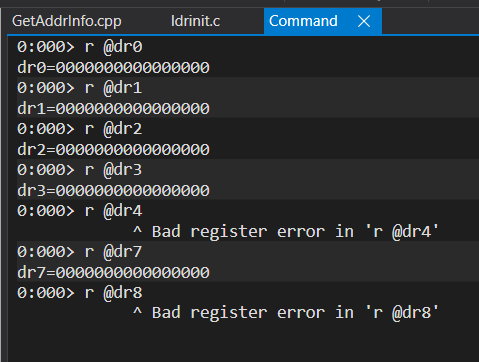
That’s a hard NO again. All debugger registries are empty, and yet I had a breakpoint set. Shit. Time for a new hypotheses.
Chapter Four: Side-attack
Following multiple failed attempts to locate the 0xCC, I concluded that if the breakpoint really is there, it should be visible from a separate app. So I went and asked ChatGPT to write me a super-simple C++ app that opens the remote process and reads the specific memory address.
Here’s the simplified code:
std::cout << "Enter the Process ID (PID): ";
std::cin >> processID;

std::cout << "Enter the memory address to read from (in hexadecimal): ";
std::cin >> std::hex >> address;

// Open the process with necessary access rights
HANDLE hProcess = OpenProcess(PROCESS_VM_READ | PROCESS_QUERY_INFORMATION, FALSE, processID);

if (hProcess == NULL) {
	return 1;
}

// Attempt to read 8 bytes of process memory
if (ReadProcessMemory(hProcess, (LPCVOID)address, &buffer, sizeof(buffer), &bytesRead)) {
	std::cout << "Memory at address 0x" << std::hex << address << " contains: 0x"
		<< std::hex << buffer << std::endl;
}
And here’s the result:
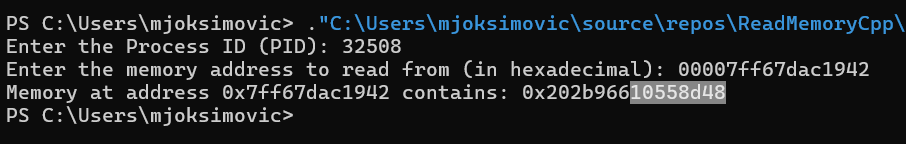
Now this is completely insane honestly. I accepted that WinDbg might be lying to me, and that two or more WinDbgs know how to work together, but why in the world is a completely separate app not able to see the 0xCC? What’s the catch?
Some more binging around led me to yet another StackOverflow where person asked something around the lines of “would the process be able to see it’s breakpoints?” and the chosen answer was “yes”. So I decided to give it a shot. I used WinDbg to set a breakpoint and then resumed the execution so that I could query the memory:

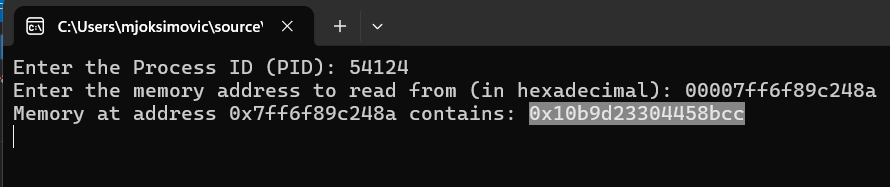
Ha! What the heck? It’s there! It’s freaking there! Querying the memory from the same process does, indeed, show the 0xCC at the end! Wow!
But this led me to a question now – what’s so special about the process reading its own memory? Why does it see something that no one else can see? What’s the catch?
I was devastated. And I decided to do a thing that I promised never to do. I did The Nasty Thing.
Chapter Five: The nasty thing
Yeah, so, the thing is that I made a promise to myself to never use private symbols or source files for the stuff that general public can’t find. As in – when I was writing aboug GetAddrInfo()’s inner workings, I exclusively utilized only the public symbols and never peeked into the source code. I believe this makes sense because I’m not really in a rush to write the article and I want to experience it the exact same way that anyone else would. So, that’s about it.
However in this specific case I was on the verge of insanity. I started tripping the great WinDbg conspiracy and was becoming pissed with the fact that WinDbg is obviously using some undocumented stuff, so I was even considering emailing the WinDbg team and bluntly asking them WHAT IN THE WORLD DOES THIS DAMN THING DO?! TELL ME! PLEASE FOR HELL’S SAKE TELL ME!
Yeah, it was that frustrating. Anyway …
So, essentially what I did is that I typed the “.dbgdbg” which is a shorthand for firing up a debugger that starts debugging the currently active debugger. Yeah, it’s cool. And I configured that other debugger to use Private Symbol Servers in order to fetch both the symbols and the WinDbg’s source code. Neat and nasty, I know.
You know what I found? NOTHING! Absolutely freaking nothing. There were breakpoints, you could enable and disable them, they were definitely evaluating the code at the instruction where breakpoint is set, but there was NOTHING that’d point me to the answer of what is ACTUALLY happening. I realized that each breakpoint is an object that seems to subscribe to ENABLE/DISABLE events, but there was just too much of a code to grasp it in a short period. But again, there was NOTHING out of ordinary. NOTHING. Which made it even more crazy because, if there’s nothing strange there, then it’s possibly working the way everyone says it does. So what the hell is the freaking catch?!
Chapter Six: Occam’s razor
You know what’s interesting? I searched for the answer numerous times but it was JUST ONCE, I kid you not, just once that I managed to find a StackOverflow article where the person asked a question among the lines of “Why does WinDbg not show 0xCC” and then they proceeded to answer their own question with “Never mind. I figured that it seems that WinDbg is removing breakpoints when it breaks the execution, and restors them when you run the process“. HOLY SHIT! HOLY SHIT! I kid you not, this was an absolute HOLY FREAKIN’ SHIT moment. Is THAT what the case is? Really? Was it THAT simple the whole time? The whole thing was that the breakpoints are REMOVED when you pause the execution, and restored back once you resume? NO FREAKING WAY!
And yet, it indeed turned out to be the case. Believe it or not, it was THAT simple. As Occam’s razor suggests, the simplest answer is usually the right answer. There was no conspiracy or any black magic happening behind the scenes. WinDbg and my app weren’t showing breakpoint instructions because they were indeed NOT there. They are gone when you stop the execution and yet visible once you do resume (which explains the case when I actually did see them from inside the same process). Damn you!
(By the way, for whatever reason I just can’t seem to find the same article again. Makes you wonder if I dreamed about it or if it really is there in the wilderness).
To say that I celebrated the day would be an understatement. I was thrilled. Excited. Undergoing the storm of adrenaline rush. I loved it and obviously I had to share it:
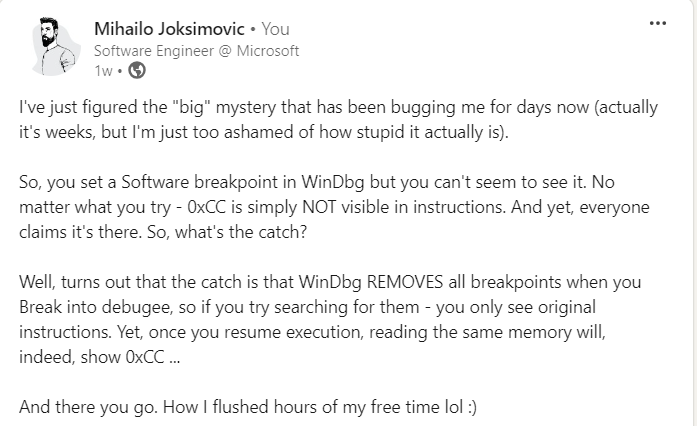
Amusingly enough, it was only after all the excitement of the “Aha!” weaned off, that I actually realized how simple and stupid does this sound. Really. Like “really? you are excited about the fact that you managed to see 0xCC in the code? Great for you!”. But still, it made me proud. Proud enough to decide to dedicate this freaking long article to it. And I’m still happy about it 🙂
Epilogue: How do breakpoints (in WinDbg) really work
So if you jumped straight to the end without reading the middle part, I’ll summarize it here for you. When you place a breakpoit, WinDbg will replace the original instruction with 0xCC. However, when you hit the BREAK and pause the execution, WinDbg actually REMOVES all breakpoints and restores the original instructions. This is likely to make it more user friendly, which makes perfect sense. Once you resume the execution, it restores all 0xCC‘s and off it goes.
And just like that, if you were to attach with non-invasive debugger (which essentially doesn’t suspend the process) and look up the instruction that has a breakpoint on it, you would, indeed, see that damned 0xCC:
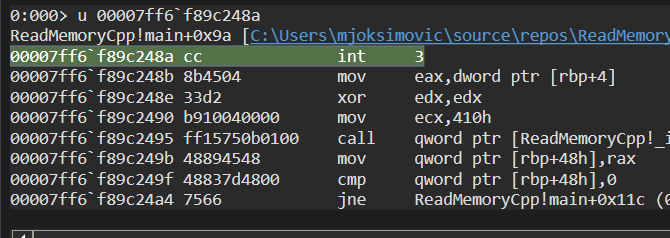
It’s there. As one would expect i to be 🙂 Cool, isn’t it?