
Alright, for those who don’t want to read my intro fart-outs, feel free to jump directly to “how to” section. For those who want to know the full story – read on.
NOTE: I also published – Part 2, Part 3. and Part 4
First things first – WTF happened with my writings and why I’m not writing as much as I used to? Well, life. Well, more specifically, my toddler learned how to run around the house and that was pretty much a game changer along with a game-over for my 2-3 times a week blog-posts 🙂
What I do try when time and energy levels permit is to do some playing around with Windows. For those who don’t know me – well, I’ve been a heavy OSX user and a huge Apple fan for the last 10+ years (if not more) and the last time I interacted with Windows was likely back in 2008 or so. I was one of those folks who’d scream that Windows sucks and that real developers use *nix-like systems and other bullshit that any youngster has to go through. But anyway, this all changed as I joined Microsoft over a year ago. The product that I’m working on (SQL Server and Azure SQL flavors) was primarily developed for Windows, so it was a no brainer that I’d use it from now on. But let me tell you this – I don’t know if it was like this back in the 2008, but Windows fucking rocks at this moment. As in, development experience is fucking amazing. Honest to God.
To cut the long story short, I’ve been playing with two pet projects lately. One started as an idea to explore how Schannel works (which is basically a Windows’ version of OpenSSL) and another one is about finding every possible way to attach debugger to a process before the very first instruction is executed. As you could imagine, this blog post is about #2 🙂
For those who have been doing Windows development for a while, this is probably old news. But for newcomers like I am, the question of “how the hell do I attach to process before it executes anything” is quite a mistery. Amusingly enough, it took me just a bit over a year to realize that it’s actually quite damn simple 🙂
To set the expectations right, my idea is to write multiple blog posts on this topic. And this is simply because I’m just curious to explore every possible way to actually achieve this. Here is what I have on my mind, in no specific order:
- Use some “internal” help (i.e. GFlags). This will be the theme of this post.
- Modify the .EXE and inject some bits that’d force process to sleep for 10-15 secs (just enough to attach with debugger).
- Inject extra DLL the moment that process starts and introduce sleep in it.
- Use another process to bootstrap the target process in suspended mode, attach with debugger and resume it.
- That’s about it that I could come up with at the moment.
Obviously, these are just some ideas that I have and they might or might not work. Frankly I have no clue and I want to try them out. If you’re wondering WHY – well, because I think its fun. And it gives me a chance to explore some inner-workings of Windows. And yeah, it’s fun 🙂
Oh, and if you’re wondering why the hell would anyone want to attach to process “before it starts” (technically – attach and break immediately) — well lots of reasons. You might want to see what happens from moment zero. You might want to investigate a crash that happens too fast and you can’t take a dump fast enough (no pun intended). Or you might be just curious to see what are the ways to alter the process behavior.
So, without further bullshit, let me jump to the simplest options — Global Flags (usually called “GFlags).
Using GFlags to attach debugger to process the moment it starts
GFlags (shorthand for Global Flags) is basically a simple app, or shall I say “interface” to various Registry settings. Or at least that’s my current interpretation. This is how it looks like:
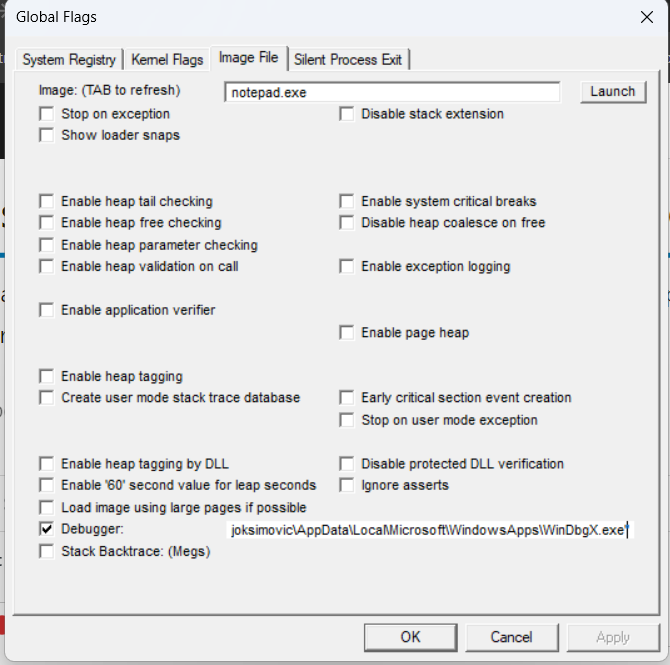
Mind you, I switched to tab 3 – “Image File” which focuses on single image (or – process in this case). It allows you to configure bunch of useful stuff for a specific process. In my case I’m using notepad for no other reason than the fact that I won’t suffer too much if I destroy it along the way 🙂
So anyway, assume that I want to break into debugger the moment I open Notepad. Well, I specify “notepad.exe” and I check the “Debugger” option and I enter path to WinDbgX there. Mind you, I tried with Visual Studio’s “vsjitdebugger.exe” but it just refused to work and I’m more inclined to play with WinDbg so I’ll just stick to that.
Anyway, what this actually does is it updates the Registry Settings at Computer\HKEY_LOCAL_MACHINE\SOFTWARE\Microsoft\Windows NT\CurrentVersion\Image File Execution Options\Notepad.exe like so:
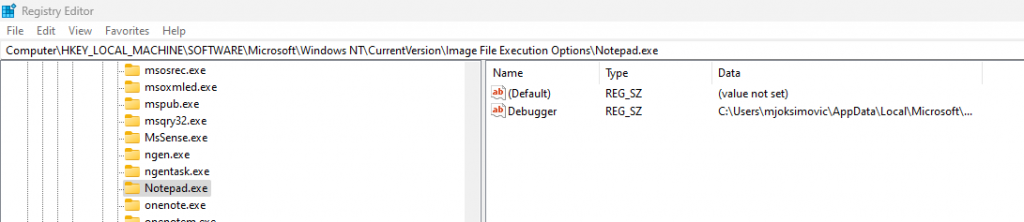
Basically it just adds a “Debugger” entry with a path to Debugger that you want to start. So technically, you could do it without GFlags, but it’s just easier with it. And once you do start notepad, here’s what happens:
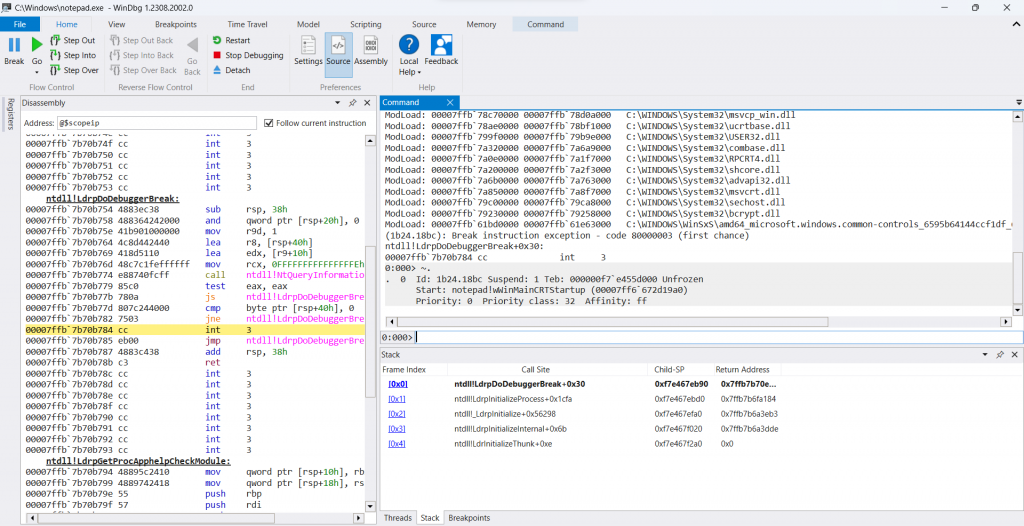
Woila! It halted and started debugger before anything was executed in Notepad 🙂 From there, it’s up to you to decide WHAT you want to do. And options are limitless, but I’ll leave that for another blog post.
Why this works?
Interestingly enough, the way I see it is that Windows wants to help you do stuff. Seriously. And basically the simplest way to attach to process before it executes the first instruction is to simply have Windows help you do that. And GFlags are a great way of doing that!
There are some limitations that I’ve experienced though. If you have a process that is started under “SYSTEM” user for example, well, the debugger will start but you won’t be able to access it, which kind of sucks 🙂 I did come up with some entertaining workarounds (basically start debugger with -c “~* n; .detach; q” and then attach with new debugger and resume) but I’ll leave that for another time 🙂
Hope you found this useful!
5 thoughts on “Attaching debugger immediately after process starts – Part 1”