
Last time we discussed possibility of using CDB and starting a Server so that other debugger can attach. This time I’m going to discuss something that I’d probably refer to as “flexing”, simply because it’s probably not something that you’d want to do if all you need is to attach to process immediately (as a reminder – plain old WinDbg or Visual Studio in combo with GFlags should suffice).
NOTE: Here are direct links to previous articles – Part 1, Part 2 and Part 3.
So, what do we want to do? I want to use a technique called DLL injection, which pretty much boils down to writing your own DLL and injecting it into a running process. Furthermore, what I want this DLL to do is to take all the active threads, suspend them, wait for 20 seconds and then resume them. This isn’t super interesting from the point of view of attaching a debugger, but what I found amusing is the fact that you can actually inject a code into running process and Windows provides you with native API functions to actually achieve that.
Let’s start with the DLL code. As I mentioned above, what I want is to get a list of all threads, suspend them, wait 20 secs, and then resume them. That’s really all I want my DLL to do. I found the code for fetching all threads in Windows Docs and I just made minor modifications to make it do what I wanted it to do:
#include <Windows.h>
#include <tlhelp32.h>

BOOL APIENTRY DllMain(HMODULE hModule, DWORD ul_reason_for_call, LPVOID lpReserved)
{
    // We want to execute only when the DLL loads
    if (ul_reason_for_call == DLL_PROCESS_ATTACH) {
        MingleWithProcessThreads(GetCurrentProcessId());
    }

    return TRUE;
}

BOOL MingleWithProcessThreads(DWORD dwOwnerPID)
{
    HANDLE hThreadSnap = INVALID_HANDLE_VALUE;
    THREADENTRY32 te32;

    // Take a snapshot of all running threads
    hThreadSnap = CreateToolhelp32Snapshot(TH32CS_SNAPTHREAD, 0);
    if (hThreadSnap == INVALID_HANDLE_VALUE)
        return(FALSE);

    // Fill in the size of the structure before using it.
    te32.dwSize = sizeof(THREADENTRY32);

    // Retrieve information about the first thread,
    // and exit if unsuccessful
    if (!Thread32First(hThreadSnap, &te32))
    {
        CloseHandle(hThreadSnap);     // Must clean up the snapshot object!
        return(FALSE);
    }

    do
    {
        // CreateToolhelp32Snapshot returns a snapshot for ALL processes on system,
        // so what we want to do is filter out everything but threads for current PID.
        if (te32.th32OwnerProcessID == dwOwnerPID)
        {
            // Don't suspend the current thread! We need it working so that it can
            // sleep for 20 secs and then resume everything it suspended.
            if (te32.th32ThreadID != GetCurrentThreadId()) {
                HANDLE hThread = OpenThread(THREAD_SUSPEND_RESUME, true, te32.th32ThreadID);

                if (hThread != nullptr) {
                    // Let's just be optimistic and hope that thread actually got suspended.
                    // Keep in mind that the return value of this function is the thread's
                    // suspend count (you can have more than one request to block a thread!).
                    SuspendThread(hThread);
                }
            }
        }
    } while (Thread32Next(hThreadSnap, &te32));

    // We suspended all threads so let's rest for 20 secs
    Sleep(20000);


    // Reset the thread pointer
    if (!Thread32First(hThreadSnap, &te32))
    {
        CloseHandle(hThreadSnap);
        return(FALSE);
    }

    // Iterate all over again but resume them this time!
    do
    {
        if (te32.th32OwnerProcessID == dwOwnerPID)
        {

            if (te32.th32ThreadID != GetCurrentThreadId()) {
                HANDLE hThread = OpenThread(THREAD_SUSPEND_RESUME, true, te32.th32ThreadID);

                if (hThread != nullptr) {
                    ResumeThread(hThread);
                }
            }
        }
    } while (Thread32Next(hThreadSnap, &te32));

    CloseHandle(hThreadSnap);
    return(TRUE);
}
Cool! That’s our DLL code. Next thing is to actually get this DLL injected into a process that just started. Now, given that my primary motivation wasn’t about figuring out all the ways to inject DLL into process (although some people really listed all possible ways to do so), I was lucky enough to find a toy project of a person who wrote WinDbg extension called !injectdll. Usage is actually quite simple – during the debugging session, all you need to do is invoke “!injectdll <path to DLL>” and it does what is needed in order to make this happen:
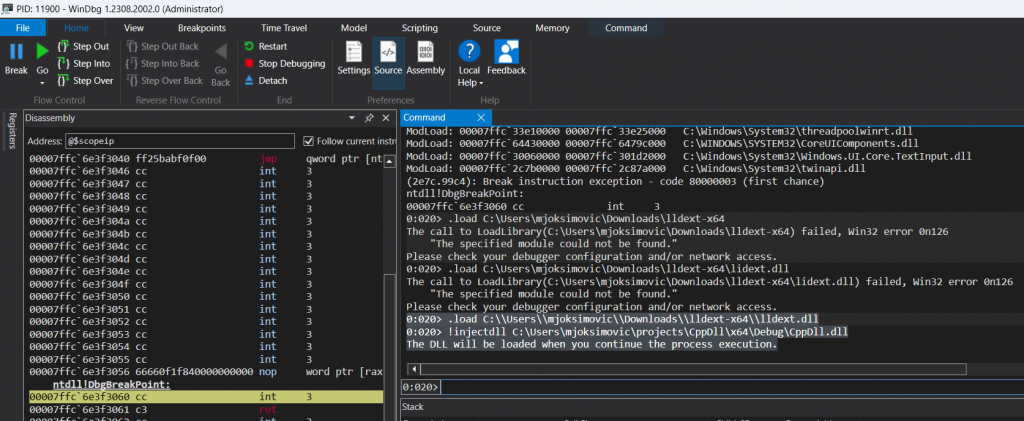
I executed (and highlighted) two commands:
- I invoked
.loadto actually load the !injectdll extension - I invoked
!injectdllto get the DLL injected into currently debugged process
The result, as can be observed from screenshot, is that the extension let me know that the DLL will be executed as soon as the process starts. After resuming the process and then breaking it again, I can observe the DLL being loaded:
As I said before, I don’t want to go too deep into the process of how DLL injection works, mostly because I don’t really have much at the moment and I want to write a separate article about it anyway. In a nutshell, it boils down to these steps:
- Allocate memory in remote process using VirtualAllocEx.
- Store the name of the DLL to be loaded in the previously allocated slot.
- Create new thread in remote process using CreateRemoteThread and invoke LoadLibrary from kernel32 module.
You can see this at play either in the !injectdll extension’s source code itself. As I said, I will be writing a full article that will cover this exact topic, but that’s a story for some other time. The point is that you can use Windows’ native API to create a new thread in remote process and to inject DLL into it.
The end result? Process (in this case – Notepad) will be suspended for 20 seconds, and it will resume its operation afterwards.
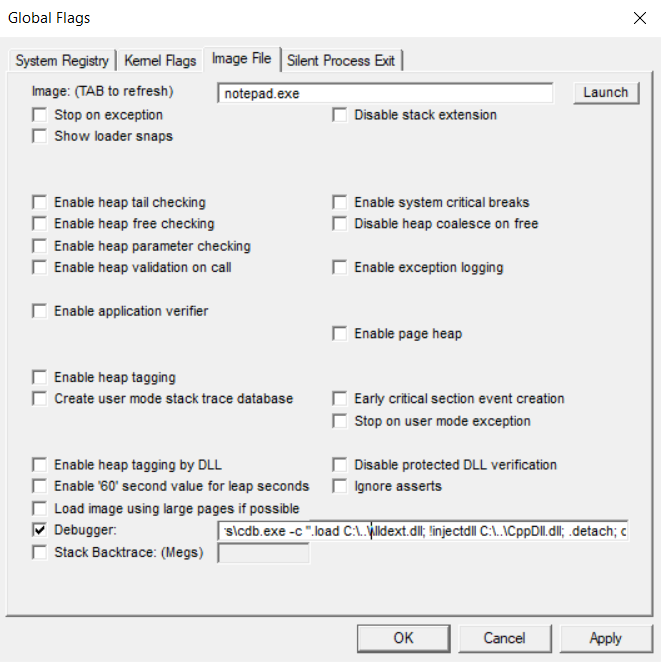
Let’s combine all of this so that it happens when the process starts. As a reminder, we will rely on Image File Execution Options and Debugger parameter, which basically serves as a hook that gets executed when image is about to be loaded.
What I’m going to specify for Debugger path is the following:
C:\Debuggers\cdb.exe -c ".load C:\..\lldext.dll; !injectdll C:\..\CppDll.dll; .detach; q"I’ve purposefully ommitted the full paths but I think you get the idea. Here’s how it looks like in GFlags:
If you’re read previous posts, you probably know what this line does. But if not, here’s a quick breakdown:
-cargument forces cdb to execute the commands under quotes.loadloads the WinDbg extension that contains the !injectdll!injectdllinjects the DLL into the process being debugged.detachdetaches the debugger so that process can continue working without itqshuts down the cdb
The end-result of this is the moment you start notepad.exe, the DLL gets injected into it, pauses all threads for 20 secs, and then resumes them 20 secs later. Obviously, you can attach with another WinDbg or Visual Studio in the meantime if you want to.
2 thoughts on “Attaching debugger immediately after process starts – Part 4”