
Last time we discussed DLL injection and using DLL code to suspend all threads in process for 20 secs, giving you enough time to attach with debugger. This time I’m going to share something different that I played with during the weekend – writing your own “debugger”. But that requires a bit of a backstory.
Reason why I started this whole series of “how to attach debugger to process the moment it start” is because I actually had no clue how to do it. Honestly. The problem is that by the time you fire up a debugger, the process might have executed tons of instructions already and might have as well crashed (which is actually what happened to me). So out of curiosity I started exploring various ways to attach to process the moment it starts. What I learned is that, in a nutshell, it really boils down to three options:
- Let Windows OS help you do that. And this is by far the simplest way – you can use “Debugger” parameter in Image File Execution Options (IFEO) to set a Debugger that would fire up when process starts. If you read previous four articles, you probably realized that this is what I’ve been doing the whole time.
- Write another app that starts the process that you want to debug. This allows you to mingle the process in any way you want.
- Modify the .EXE in-place and introduce a Sleep(). I haven’t really tried this (yet), but it’s definitely easier to do it with .NET and CLI/CLR than it is with Native bits.
If you’ve been reading previous articles, you couldn’t have missed the fact that I kept relying on Windows helping me attach with WinDbg and then I kept playing with various ways on how to halt/suspend the stuff. And the way this works is simple – if you want to, say, start a Debugger when Notepad.exe launches, what you need to do is to place a Debugger registry entry under Computer\HKEY_LOCAL_MACHINE\SOFTWARE\Microsoft\Windows NT\CurrentVersion\Image File Execution Options\notepad.exe, like so:
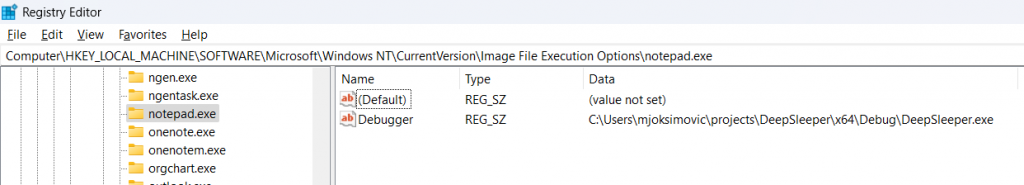
What you’d USUALLY do is specify path to WinDbgX.exe or VSJitDebugger.exe (if you want to debug using Visual Studio), and the moment you start notepad.exe, you’d see Debugger being launched and halted before the process started. Cool stuff and really simple!
This got me wondering, though. I was wondering – WHAT EXACTLY is it that Debugger does in order to hijack the process the moment it starts? There has to be SOMETHING that it does, but what is it, really? So what I did is pretty simple – I wrote my own app and logged the parameters that are passed. Suffice to say, I expected everything except what I really received on input. And what I received was not a Process ID or anything similar. Nope. What I received was a full path to Image that user wanted to execute (in my case it was full path to notepad.exe).
Now this is really interesting. It’s interesting because I expected that there’s some deep-shit magic that happens deep inside Windows Kernel that somehow mingles with Process’ startup and by some voodoo injects debugger into the process. Nope. All that Debugger receives is path to Image that should be executed and that’s about it. Turns out Malware really loves this one trick, but Anti Virus’ are aware of it as well. But I digress.
Anyway, this led me to a question – how hard would it be to write my own app that’d act as a debugger and simply delay process’ execution for 20s, giving you enough time to attach. And if you’re wondering why is this useful – trust me, there are cases (e.g. Containers) when you don’t want to copy the whole Debugger inside the container.
So naturally, my first attempt was to write minimal code that accepts the image path, and starts the process. I just copied the code from MS Docs and this is the shortened version:
int main(int argc, char* argv[])
{
    if (argc < 2) {
        cout << "First argument must be path to Image." << endl;
        exit(1);
    }

    STARTUPINFOA si;
    PROCESS_INFORMATION pi;

    ZeroMemory(&si, sizeof(si));
    si.cb = sizeof(si);
    ZeroMemory(&pi, sizeof(pi));

    if (!CreateProcessA(
        nullptr,
        argv[1],
        nullptr,
        nullptr,
        false,
        0, // Process flags. This will be IMPORTANT!
        nullptr,
        nullptr,
        &si,
        &pi
    )) {
        cout << "ERROR: Failed to start proces " << argv[1] << endl;
        exit(1);
    }

    // Rest of the code has been removed for brevity. You can find it below.
Nothing fancy really. We just invoke CreateProcess() function and pass the path to Image File that is about to be executed.
This worked. But not as one would expect 🙂 What actually happened when I double-clicked on Notepad is:
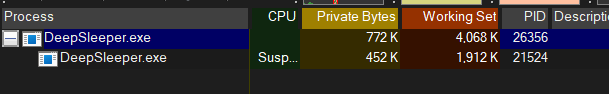
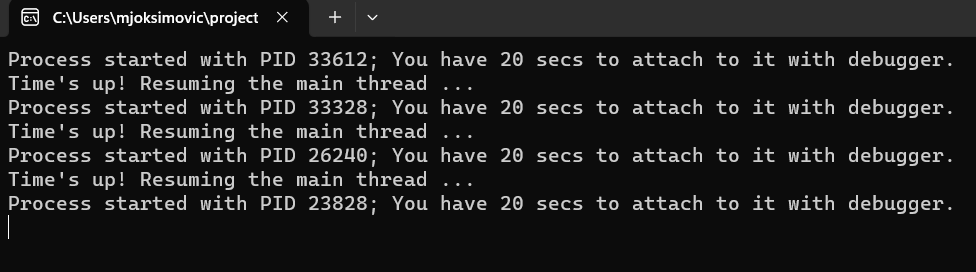
Ouch! Definitely not what I expected 🙂 What actually happened, which makes a lot of sense is – Windows launched my DeepSleeper, which in turn launched Notepad.exe. However, launching Notepad.exe triggered Windows to, you know, launch my DeepSleeper, which in turn launched Notepad again, etc. 🙂 So I ended up in a circle. Crap.
This further led me to question – what the hell does Debugger do so that it avoids triggering another instance of Debugger? It was obvious at this point that it DEFINITELY launches a new process (i.e. it’s not like Windows created a Process and then invoked the debugger with PID), but what I couldn’t figure out is – HOW it does that? And mind you, I have a rule that I definitely DO NOT want to look into Windows’ source code and I really want to keep it on a level that anyone else can reproduce.
Well, just like the last time, it turned out that there’s nothing spectacular that Debugger does. It’s actually way more simple than I anticipated. Remember when I mentioned in code above that Process Flags will be important? Yeah, we come to that part now.
Here’s an updated code that will do exactly what I expected it to do:
#include <iostream>
#include <Windows.h>

using namespace std;

int main(int argc, char* argv[])
{
    if (argc < 2) {
        cout << "First argument must be path to Image." << endl;
        exit(1);
    }

    STARTUPINFOA si;
    PROCESS_INFORMATION pi;

    ZeroMemory(&si, sizeof(si));
    si.cb = sizeof(si);
    ZeroMemory(&pi, sizeof(pi));

    if (!CreateProcessA(
        nullptr,
        argv[1],
        nullptr,
        nullptr,
        false,
        DEBUG_PROCESS | DEBUG_ONLY_THIS_PROCESS, // Process flags!
        nullptr,
        nullptr,
        &si,
        &pi
    )) {
        cout << "ERROR: Failed to start proces " << argv[1] << endl;
        exit(1);
    }

    SuspendThread(pi.hThread);

    DebugActiveProcessStop(pi.dwProcessId);

    cout << "Process started with PID " << pi.dwProcessId << "; You have 20 secs to attach to it with debugger. " << endl;

    Sleep(20000);

    cout << "Time's up! Resuming the main thread ..." << endl;

    ResumeThread(pi.hThread);
}
The only thing that I modified here is that I passed the following process flags – DEBUG_PROCESS | DEBUG_ONLY_THIS_PROCESS. You can read more about them here. What this does is tells the Windows that we will be debugging the process that is about to be created and, in turn, we definitely DO NOT want to launch another Debugger session, because we ARE the debugger. Cool!
Double-click on Notepad.exe again and it works as expected now:
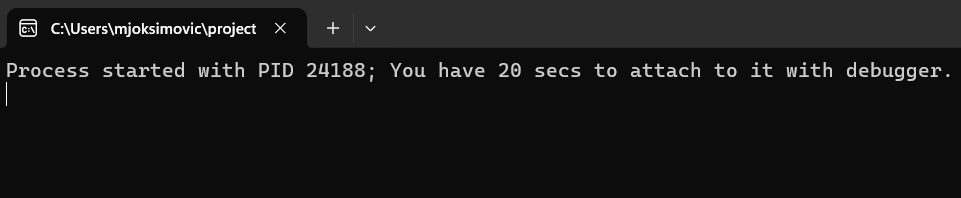
The rest of the code (i.e. after CreateProcess) is probably quite clear. What we are doing is – suspending the process’ main thread so that nothing gets executed, then we detach as debugger (because otherwise no other debugger would be able to attach), we sleep for 20s letting another debugger attach and finally we resume the Main Thread.
And that’s about it! Works like a charm 🙂