Part 1 discussed the simplest way of just using GFlags and Debugger path. And if you’re new to these series of articles, I’d advise you to start there. Part 2 touched a bit on the topic of debugging processes started under different account (e.g. SYSTEM), where I suggested to just increase the SUSPEND counter on all threads, quit the debugger and re-attach with new one. In this article I’ll discuss another way of attaching to processes started by another account.
NOTE: Here are direct links to previous articles – Part 1, Part 2 and Part 4.
As a reminder, if you have a process started by, say, SYSTEM account, specifying Debugger in GFlags will work, but you won’t be able to access the debugging session; at least not without some workarounds. Luckily, there’s a way simpler way that I wasn’t even aware of when I wrote Part 2. And the simpler way boils down to the fact that Windbg has a “-server” parameter, which basically sets up a listener that waits for another debugger to attach. If you weren’t aware of it, I’d highly suggest you look into Microsoft Docs on activating a debugging server.
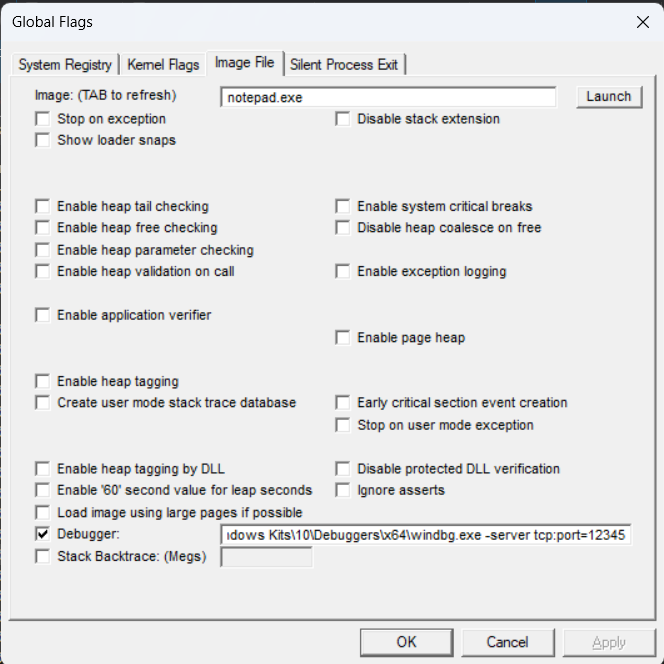
Anyway, it’s really as simple as it sounds. First step, obviously, is to fire up GFlags and specify the Debugger:

Here’s the Debugger part:
C:\Program Files (x86)\Windows Kits\10\Debuggers\x64\windbg.exe -server tcp:port=12345What this effectively does is that when notepad.exe is started, it will start a debugger immediately and open a listener on 127.0.0.1 and port 12345.
Next, I’ll start notepad as a SYSTEM account:

I can confirm its running under a SYSTEM account:

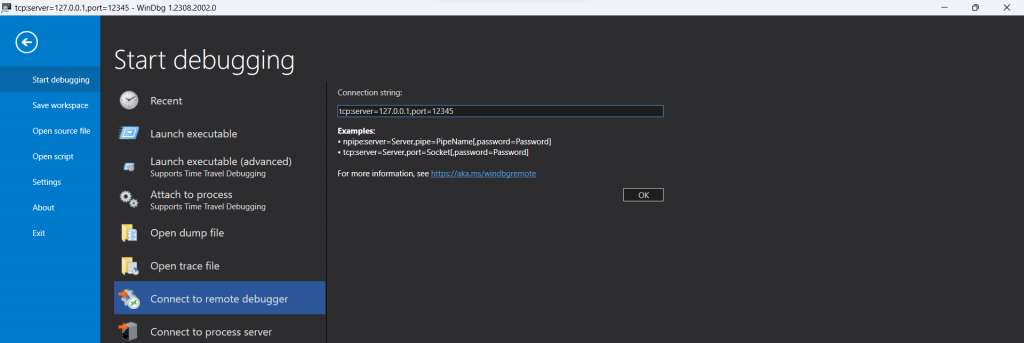
Finally, I’ll fire up WinDbg from my current account, navigate to “Connect to Remote Debugger” and specify the localhost and port 12345:

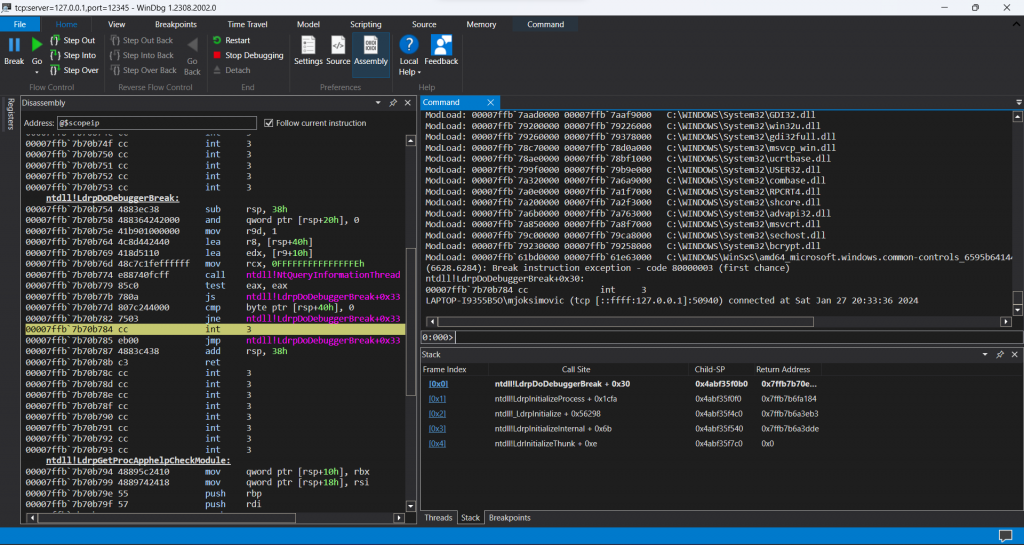
Unsurprisingly, it works like a charm 🙂

If you check the “Stack” tab in the bottom-right, you will see that it halted literally at the moment zero – i.e. at the time when process is about to be booted up. Great job! 🙂
There’s “cdb” as well!
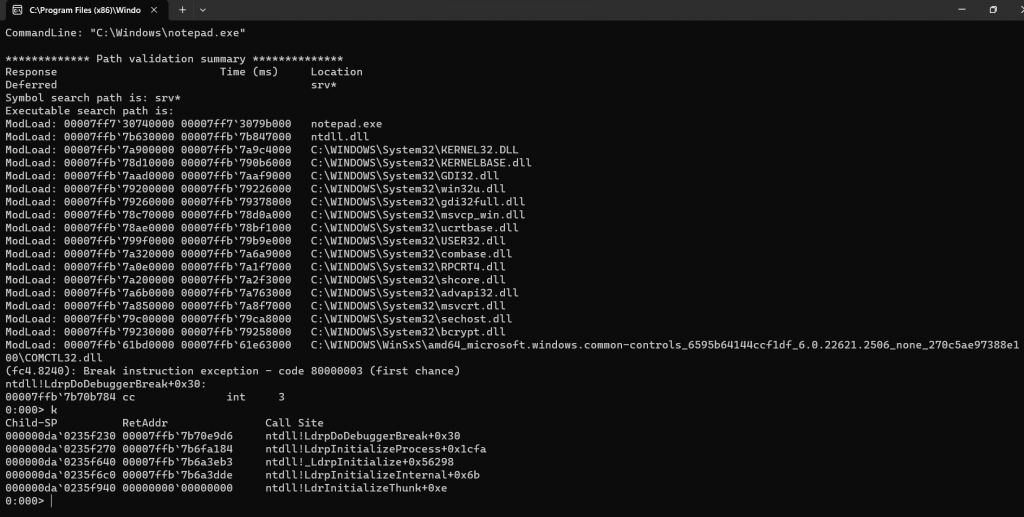
As I mentioned in Part 1 already, I’m relatively new to Windows and WinDbg was something I haven’t played with before. Unsurprisingly so, I also learned that there’s also a “cdb” which stands for “Console Debugger”. Generally speaking, my understanding is that it works EXACTLY the same as WinDbg, except that it works from Console:

The output above is what you see if you use CDB instead of WinDbg. Reason why I mention it is because it requires less resources, given the fact that there’s no UI, hence it might be preferrable option if you are trying to debug a remote process 🙂

2 thoughts on “Attaching debugger immediately after process starts – Part 3”