

First things first – why hijacking and not jumping on? Because the hijack is what perfectly describes my journey into the Machine Learning (ML) world.
It wasn’t a straight linear process of – start with basics of math, then add some python over it, then a bit of algebra, etc. No.
It was a point blank HIJACK. Being thrown into a lava and having to either learn to SWIM and SURVIVE or get burned the hell out.
I think I managed to swim out of it, but it burned the hell out of my ass. These days I am proud that I have those scars, but hell, it was everything but not a pleasurable experience.
Oh, and if you are wondering – “why yet another article on how to do ML” – it’s because this one is different! It will not teach you how to write Python code and do stupid stuff fast, but rather will give you all the necessary topics you SHOULD explore (accompanied by HOWs) if you never experienced anything ML related before.
How I ended up in it in the first place?
By accident! Really! By a pure coincidence, accident and a bit of stupidity!
The thing that some of you know about me is that I finished College (i.e. 3 years) and acquired my Bachelor of Applied Science degree on a regular timeframe (i.e. after high school). Then I had like 5 years “break” where I actually did real work, but for whatever crazy reasoning I decided to re-enroll in University and get a Bachelor of Science Degree. There really wasn’t any specific reason why I did it, except that I found it interesting; and that my father kept bothering me about it since I graduated high school.
Unexpectedly so, but I found this “comeback” to be one of the smartest things I ever did. First of, for the first time ever, I actually studied stuff because I was genuinely interested in it (which is a luxury, honestly) and, for two, it introduced me to some things I’d probably never even consider looking into. Eventually it led me to getting acquainted with a professor who’d, aside from being an amazing source of inspiration, later start a brand-new Master’s programme.
It was never my intention to pursue higher education. Simply because I saw no purpose in it. But the combo of this professor whom I loved, and the fact that the programme was called Data Science, coupled with my therapist who saw a great opportunity to have my ass dropped into a new and unknown territory, eventually led to, you know, myself enrolling in it.
Fun fact is that, at the time, my thinking process was like – well, I’m good at programming and I guess I can learn pretty much any new language. Given that Data Science sounds like something that is related to programming – how hard could it be, right?
As luck would have it – I had no freakin’ idea what I was getting myself into, and yes, it busted my balls on couple of occasions, but, honestly – it was well worth it.
Let me first tell you what Data Science is at all …
What the heck is Data Science?
A perfect example of Expectations vs Reality. Really.
What I thought it is – just another programming thing to learn over the weekend.
What it really was … well, you know how if you want to play smart, you always share Venn Diagram? Yeah, here’s mine:

My expectations turned out to be one third of what there really is … and that sucked … for a while 🙂
I’ll gently ignore the Domain Knowledge part, because, that’s really something you learn at your workplace. As such – you can’t do much upfront.
Computer Science knowledge should be an obvious one as well. As in – yes, solid part of Data Science is knowing how to write code. But I guess you already knew that, so let’s skip it as well.
This leaves us with Math & Statistics. And now, I might hear some of you saying – yeah, that’s all true, just like you need math skills for being a programmer … Haha …
I’m happy to tell you that you’re incredibly wrong!
I take that back actually – yes, you CAN do Data Sciency stuff without knowing the math & statistics. But, that’s possibly like calling yourself a programmer if you only learned HTML & CSS … I mean, sure, you can make some basic stuff happen, but if you need anything deeper, or, god forbid, solving something that can’t be solved with pure coding skills – you’re in for a trouble.
So no, please refrain from jumping into Machine Learning if you’re not interested in understanding the inner workings of it.
Now comes the fun part really – if you never loved math, that’s actually because your teacher likely sucked. It’s tough one to say but it’s a matter of fact. I, for one, hated it. I always thought it’s pointless crap that no one needs. “Why, hell, I’ve been making shitload of money and I never really needed that fucking math! Who needs fuckin’ trigonometry anyway?”.
Shitty thing about not knowing what you are not knowing is that, unless you are aware that you DO NOT know something – you’re literally in a pickle. I mean, yeah, I never needed the math for my day to day work, but I never was tasked with building a game engine; or optimizing an ML model; or writing a graphics library. You get the gist, I hope?
If we may agree that you absolutely and undoubtedly need to know some math, we may proceed to the next section.
What Math & Statistics knowledge do I need? And how to obtain it?
I’m glad that you asked! Because I will be happy to tell you.
For one – saying that you need to know MATH or STATISTICS, really makes zero sense honestly. But I was building my case up to this point.
What you really need are SPECIFIC areas of these two. And they are so specific that NOT knowing them should and will hurt you. Because you’re a douche!
Here is what you absolutely should get yourself familiar with (in this specific order):
- Linear Algebra
- Basics of Statistics (as in – basic terms like variance, distribution, error, etc.)
- Calculus
On top of that, it’d be nice if you familiarize yourself with:
- Discrete math (it’s actually amazingly cool field that makes SO MANY things possible!)
- Probability
Let’s briefly cover each and why you need it.
You should familiarize yourself with Linear Algebra because basics of it are vectors, matrices and operations that include them. Coincidentally, that’s EXACTLY what you will be dealing with if you are about to do ANYTHING ML related. Here’s an image that depicts ML in it’s most basic form:

Let me tell you something else – Linear Algebra is INCREDIBLY interesting! Ever thought how the game rendering is done? Or graphic tools are built? Or maybe face recognition is implemented? Yep, it’s all Linear Algebra!
There are TWO ways to learn some basics, and I suggest you to go with easier (and more fun one first). There’s a guy who calls himself 3Blue1Brown who, among other things, is incredibly passionate about math and teaching it to wider audiences. So, you absolutely MUST CHECK his video series on Linear Algebra.
Once you are done with it, if you want more nerdy details, you can check out the MIT’s recordings from Linear Algebra classes.
Regarding Statistics, even though the above-mentioned guy DID start some video series on it, it’s not even close to what he recorded about Linear Algebra. So, I can wholeheartedly recommend an INCREDIBLY AMAZING book that I went through, called – Statistical Modelling: A Fresh Approach.
Even though the whole book is really cool & fun to read, you really need just the first half (or even less) in order to get yourself familiar with terminology.
If you’re wondering WHY you’d need statistics – because you CAN NOT do anything without it! Here’s a Wikipedia definition of statistics:
Statistics is the discipline that concerns the collection, organization, analysis, interpretation, and presentation of data.
Source: Wikipedia
So, if you’re working with data, which ML really is all about, then you need to know the basic terminology; and that’s what statistics is 🙂
Finally, Calculus. Why the heck would anyone need that, right? As it turns out – Calculus is all about working with functions. And honestly speaking, if there were no Calculus, there would never be Linear Algebra and definitely no ML at all!
Calculus is like that old grandpa based on whose wisdom everything else was built!
So why I left it for the end? Because, sadly, you CAN live (and do ML) without knowing much of it. But it’s a pity! It’s a pity because so many things related to TRAINING of your models, optimization functions, etc. are actually Calculus topics 🙂 If you have a function (and remember – ML Model IS a function that maps input vector to an output one) – Calculus will give you tools to analyze it!
Luckily, 3Blue1Brown guy published series of videos on Calculus as well, so, that should be your first stop! For any deeper insights, MIT’s Single & Multi variable calculus is your friend!
Can math REALLY be fun?
Surely MathIsFun.com creators think so, but I digress.
If you watched any of 3Blue1Brown’s videos, you’d see that it definitely can be fun! And it really all depends on the teacher 🙂
But, ok, let’s for a moment forget all and let’s see a really simple demonstration of the thin-line between math & machine learning.

This graph depicts relation between height (horizontal axis) and weight (vertical axis) of random sample of 18 year olds.
If you noticed that there is a correlation, as in – the taller the person is, the heavier they are, then you are probably on a good path towards calling yourself a matematician! Because, YES, there IS a correlation! And it seems to be that weight of a person can be expressed as height - 115. Let me draw a line that would represent such observation:
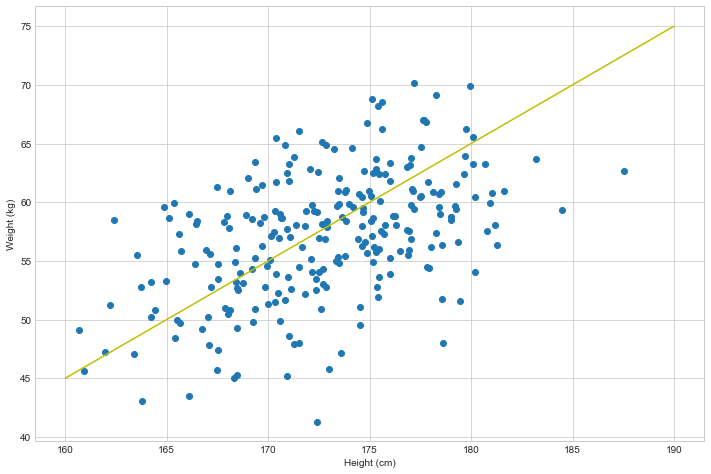
And frankly, that’s quite close to what it really is! And matematicians would say that weight is a function of height, and can be expressed as weight = height - 115. And if I were to ask you – what would be approximate weight of a person that is 200cm tall, you could calculate that rather easy: weight_200cm = 200 - 115 = 85kg.
The thing is that finding this correlation is sometimes not that obvious. And what’s more, turns out that there is a beautiful thing called Linear Regression, which tries to fit a perfect line based on your data. By summoning Linear Regression to do this for us, it tells us that the line that fits our above data perfectly is of a form: weight = 0.55 * height - 37.39:
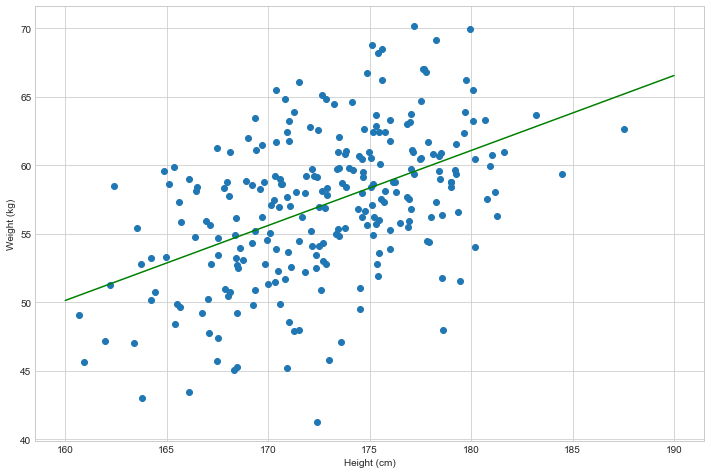
Where the hell does this formula come from, you might ask? Well, if you didn’t run away from school, you’d probably know there’s a thing called “linear equation” which is an equation of a form y = a*x + b . It also happens to have a single variable (x – which in our case is height) and the output variable y, which in our case is weight that we want to predict.
What does all this mean? This means that this equations says that there is a correlation between height and weight! And if you look at the above data, there definitely is (it’s kind of obvious – the higher you are, usually the heavier you become as well).
What’s more, Linear Regression can be used as an ML Model! Yup! It’s a simple and yet effective one. Input vector has one dimension (height) and the output vector is also a one-dimensional vector (weight).
And what’s the purpose of that line? That line is THE MODEL 🙂 If I were to ask you – what would be a weight of a person who’s height is 185cm, you can easily place them on the green line and answer that it’d be 64 kilograms.
This might also be your first introduction to THE MODEL. The ML Model. And if you never learned of it, it surely does sound intimidating, right? It’s what some might called “Artificial Intelligence”.
Frankly, there’s not much intelligence to it. And it’s rather stupid 🙂 And the artificial part is due to the fact that someone had to force that model to “build” itself. Hell, if I had NO data at all about height & weight of people, that model would NEVER come into existence. Which brings me to another thing – patterns.
ML is all about finding patterns
I’m trying real hard to avoid going into a depth of the matter, and keep it more on a breadth-level, but I had to mention this one really.
Machine Learning, at it’s core, is all about FINDING and MODELING patterns in your data.
Data can really be ANYTHING – a height-to-weight ratio, stock-market trends, spam emails, website visitors behavior … There’s simply NO universal answer to WHAT data is. Data is EVERYTHING. The only issue is – how do you vectorize that data (i.e. process of turning unstructured data into a vector). But that’s a different topic, which, if you want to learn more, is called Feature Engineering.
Let me say this again – Machine Learning is ALL about identifying patterns in your data!
Reason why I’m repeating this is, because:
If your data has NO patterns, or if you don’t have ENOUGH data to extract patterns from, your model will be useless (official term for it is – it will “underfit” your data).
Good news is that almost EVERYTHING that you can think of in this world is actually driven by patterns. Literally EVERYTHING. There even are some arguments that there’s no free will at all and, given the same circumstances, your behavior would ALWAYS be the same, no matter how many times repeated. But that’s a different story I guess 🙂
My point is that, given enough data, you can almost always extract patterns from it. And great news is that computers are actually amazing at doing so; given that you give them the right pointers.
One solid example would be a behavior of your website visitors. From the outside perspective, you might think that there’s not enough evidence to understand what drives a person to click the BUY button. But, given enough input parameters (Country, Sex, Time spent on Website, Colors of the website, etc.), or, in ML terms – given enough FEATURES, combined with enough CPU (or GPU!) power – your computer might be able to find the patterns that human CAN NOT do by mere observation! And that’s why ML is such a powerful thing!
This also reminds me of a scary story that one of my professors (Prof. Milan Tuba) shared. Namely, he claims that more and more banks are using their customers’ behavior (yes, that’s yourself) to produce models of whether to approve loan or not. And funny thing is that sometimes the number of features they are using is thousands or even millions! Hence, we are ending up with ML models which are, effectively, black boxes, that recognize SOME patterns, but nobody has any clue WHAT the patterns are! It could be that combination of how many steps you are making, combined with your weight and spending habits (you know, they have access to your credit card), somehow affects whether you will eventually lose your job due to becoming a heroin addict or alcoholic. We are literally putting our trust into models which we CAN NOT understand and yet they do work, because they DO find patterns. But we don’t know what they are … and that’s freakin’ scary!
Brief overview of what Models are
I kept talking about ML models, but I really never gave them enough description.
Models are everywhere. I even wrote an article about Data Models and ORMs.
Models are everywhere and yet we are not aware of them.
Models are a MINIFIED representation of our data. They are not a FULL-BLOWN representation, but they usually contain ENOUGH data to make a decision based on them.
If that’s confusing, let me give you a perfect example of a model — a map. A world map, to be more precise.
If you look at world map, it definitely is not a full-blown representation of world, BUT, it contains enough data that you need to understand the world. And if you want to travel from Europe to America, you can immediately make a decision how to do so, right?
That’s what models are in general. And that’s what ML Models are as well. They identify the patterns and then MODEL that behavior so that you can make a future predictions based on it.
I already mentioned it, but, just in case you missed it – Statistical Modelling: A Fresh Approach is a book that covers this specific topic!
Final word on what Data Science is
I’ve invested quite some words in this article talking about the Math & Stats part of it. Mostly because I’m sure that you are aware that Computer Science knowledge is simply a must have, and there’s a high chance you already ARE a programmer anyway.
But there’s a lot more to it. There’s a whole chapter of Data Science called Exploratory Data Analysis (EDA), which, in simple terms, means – trying to UNDERSTAND your data before trying to model it. Because, just think about creating a World Map without KNOWING how the world looks like? It makes zero sense. You can TRY, for sure, but it’s ridicolous!
This is EXACTLY why you need Statistics knowledge. Everything and I do mean EVERYTHING in EDA is statistics!
Again, would take a whole article to cover the basics of it, but I will list some useful resources at the end that you can use to further explore this topic.
Some code, finally
We’ve spent quite some time introducing the concept of Data Science, math behind all of this, etc. And reasoning is, again, very simple – if you wanted to go for a shorter article, you could have looked up any of the billion ones available online. This one is intended to go wide, so that you know what you are dealing with.
I mentioned vectors before, and we’ll finally get a chance to see them in action 🙂
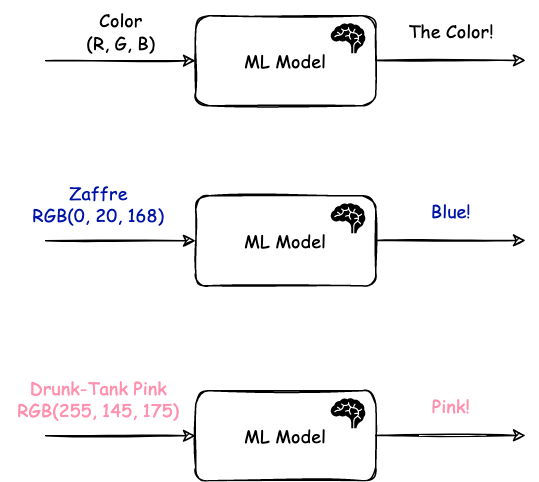
Here is what I’m going to do. I’m sure most of you are familiar with how men recognize only handful of colors, while women know plethora of them (ever heard of “zaffre” or “drunk-tank pink”)? That’s exactly what I want to build – a blackbox that takes a RGB value on input, and produces a male-friendly color on the output (e.g. red, green, blue, yellow, orange, etc.). Something like this:
The first step that we have to do is – fetch list of all funny color names, ideally combined with male-friendly version, so to speak. And reason why this is important is because this is THE BIGGEST and most cumbersome step in ML — Gathering and Processing your data! It might come as a surprise, I know, but once you have your data clean and tidy, building a model is a matter of plugging your vectors in and training your model, adjusting a bit along the way. But THE DATA is the problem. THE DATA.
I got lucky enough that I found this page that contained data in a rather friendly format:
[
   {
     "name": "INDIANRED",
     "hex": "#CD5C5C",
     "rgb": "RGB(205, 92, 92)",
     "families": ["red", "brown"]
   },
   {
     "name": "LIGHTCORAL",
     "hex": "#F08080",
     "rgb": "RGB(240, 128, 128)",
     "families": ["red", "pink", "coral", "light"]
   },
   etc.
It contains all that I need – the RGB value and the actual COLOUR (now with British accent!) listed as first element of the families key.
First step in any DS process is – clean up & turn your data into vectors. And that’s what I did:
with open("colors.json") as file:
     data = json.load(file)

 dataArr = []

 for row in data:
     dataArr.append({
         'red': row['rgb'][0],
         'green': row['rgb'][1],
         'blue': row['rgb'][2],
         'family': row['families'][0]
     })
It’s the lines 6 – 12 where I’m reshaping above data into vector format that I need for virtually ANY model – each row is one VECTOR, and each column is a FEATURE (or a dimenstion, or whatever you want to call it) of that vector. Finally, you usually use the last column as the “label”.
The outcome of the above operation is:
[
    {
        'red': 205,
        'green': 92,
        'blue': 92,
        'family': 'red'
    },
    {
        'red': 240,
        'green': 128,
        'blue': 128,
        'family': 'red'
    }
    etc.
Without going deep into the details, one thing that you want to remember is that, for most (or all?) ML operations, your data needs to be arranged as array of vectors:

If you want to see some examples of already prebuilt and preformatted datasets – head over to Kaggle.com’s Datasets and load any random dataset from there.
Going back to the code, once we have the data ready, it’s time to use it to train our model. If you skipped previous sections of the article – training is all about adjusting your model so that given the input vectors, it produces proper predictions on the output. Here’s the code:
df = pandas.DataFrame.from_dict(dataArr)

clf = sklearn.neural_network.MLPClassifier()

inputVectors = df.drop(columns=['family'])
outputValues = df['family']

clf.fit(inputVectors, outputValues)
Couple of things to cover here:
- Line 1 takes our array of vectors and creates a Pandas.DataFrame object. For now just keep in mind it’s a useful abstraction of array with bunch of functions to manipulate them
- Line 3 instantiates an Multi-Layer-Perceptron Classifier or, in simple words – a Neural Network Classifier
- Lines 5 and 6 basically prepare INPUT data for our Model (i.e. we use vectors without their Label as input, and we use Labels as expected output). We need these to “train” our Neural Network
- Line 9 “fits” our INPUT data to the expected outputs. This is what ML people usually call “training”, because we are TRAINING our network against the sample data that we have
And actually that’s most of it, believe it or not. Yes, there’s tons of details that you can adjust and work with, but this is really what it is in a nutshell.
Final step would be to see how it works. Here’s how it categorizes some randomly picked RGB colors:

Not bad! It does sound similar to what I’d say really, except for the first one which I’d rather call “green” I guess.
Here’s accompanying code as well:
print(clf.predict(pandas.DataFrame.from_dict([
    {
        'red': 107,
        'green': 255,
        'blue': 235
    },
    {
        'red': 161,
        'green': 80,
        'blue': 40
    },
    {
        'red': 99,
        'green': 151,
        'blue': 255
    },

])))

# And output:

['blue' 'brown' 'blue']
To recap what we did – we took an unstructured source of data from here, we reshaped it into list of vectors where each row is a single vector and each column is one feature (in our case – amount of Red, Green and Blue), we trained a Neural Network against it and finally tried predicting values based on previously unseen data. And that, ladies and gents, is a Machine Learning in a nutshell!
If you want to learn more
As I said in the beginning, this article was aimed at giving you BREADTH of the matter! And that breadth I share from personal experience.
If you want to explore anything in-depth, or simply focus on more hands-on experience, here are some incredibly valuable places to look at:
- Math Courses:
- Essence of Linear Algebra — video series by 3Blue1Brown and probably one of the most amazing courses I’ve ever watched.
- Essence of Calculus — same as above.
- Statistical Modeling: A Fresh Approach by Daniel Kaplan — amazing book on Statistics & building models. Must-read, really.
- MIT’s course on Linear Algebra — if you want to go in-depth on Linear Algebra.
- MIT’s course on Single & Multi variable calculus — if you want to go in-depth with Calculus.
- Books:
- Python Data Science Handbook by Jake VanderPlas — if you’re looking for a hands-on book – look no more. This one is probably one of the coolest I’ve ever worked with!
- R for Data Science by Garrett Grolemund and Hadley Wickham — amazing book that explores all Data Science topics (EDA, Feature Engineering, Modeling, etc.) through practical examples.
- Text Mining with R by David Robinson and Julia Silge — another great hands-on book on the topic of text mining.
- Data Sources:
- Kaggle.com — if you’ve never heard of it, now’s the time to check it out. Kaggle is a collection of thousands of data sets, as well as people who share their EDA and ML processes against them.
- Online Courses:
- I’m not a big fan of courses honestly, but I did consume some, which I will share below
- Machine Learning Specialization by Andrew Ng — not sure if it’s the one I watched, but Professor Andrew’s courses were some of the best out there!
- MIT’s Artificial Intelligence Course — I watched maybe half of it, but definitely can recommend it if you want to go in-depth
If you happen to have any other resource you’d like to share, please do let me know!
Other stuff you might like:
- Let’s talk about Data Models and ORMs
- How I Learned to Learn (or how to learn effectively as an adult)
If you want to stay up to date about what’s happening on this blog, you may befriend me on LinkedIn, follow my posts on Instagram and Twitter, or subscribe to RSS feed.