
I wrote five articles (part 1, part 2, part 3, part 4 and part 5) where I explored various ways on how to attach the debugger the moment the (Windows) process starts. But then I got bunch of complaints that there’s simply too much info. People were asking for tl;dr. A brief version of a sort. Well, here it is.
I’ll cover the simplest way(s) to attach with debugger right when process starts.
Image File Execution Option (IFEO) to the rescue
The absolute simplest way that requires the absolute minimum work is to use the Image File Execution Options (IFEO). I’ll explain what it is in a minute.
Let’s assume that the process that you want to attach to as soon as it starts is “notepad.exe”. What you need to do is to execute the following two PowerShell commands:
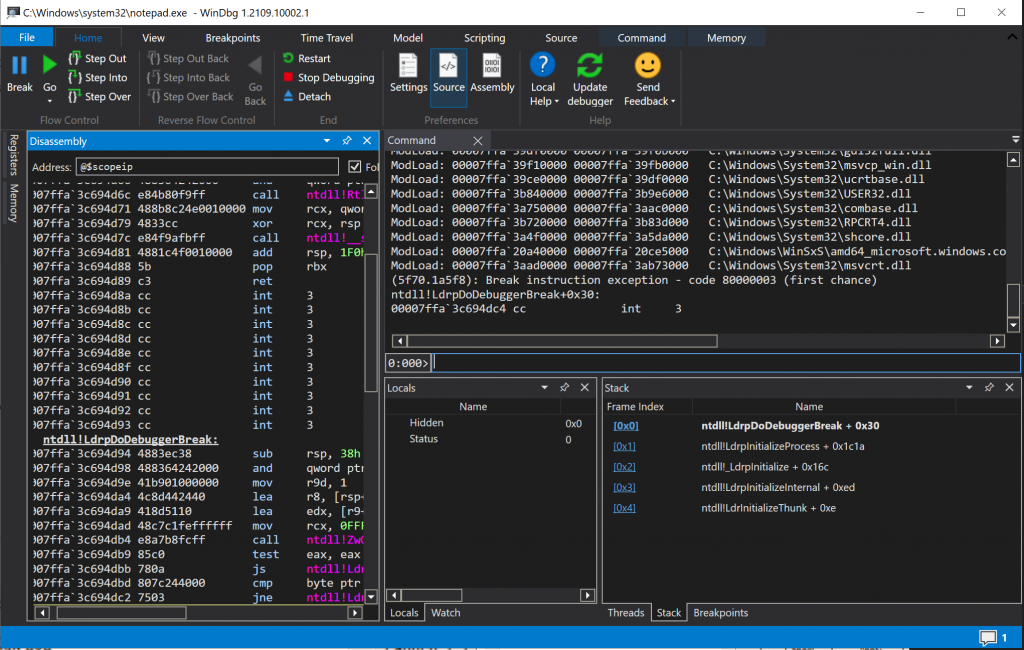
New-Item -Path "HKLM:\SOFTWARE\Microsoft\Windows NT\CurrentVersion\Image File Execution Options\notepad.exe"Set-ItemProperty -Path "HKLM:\SOFTWARE\Microsoft\Windows NT\CurrentVersion\Image File Execution Options\notepad.exe" -Name "Debugger" -Value "C:\Debuggers\WinDbgNext\drop\WinDbgX.exe"Make sure that “Value” contains a proper path to where your preferred debugger is. Now start the notepad.exe and you should end up in your favorite debugger:
Pretty cool 🙂 And don’t forget to remove once you don’t need it any more:
Remove-ItemProperty -Path "HKLM:\SOFTWARE\Microsoft\Windows NT\CurrentVersion\Image File Execution Options\notepad.exe" -Name "Debugger"In case that you have a process that is started automatically and starts under different user, you could do something like this:
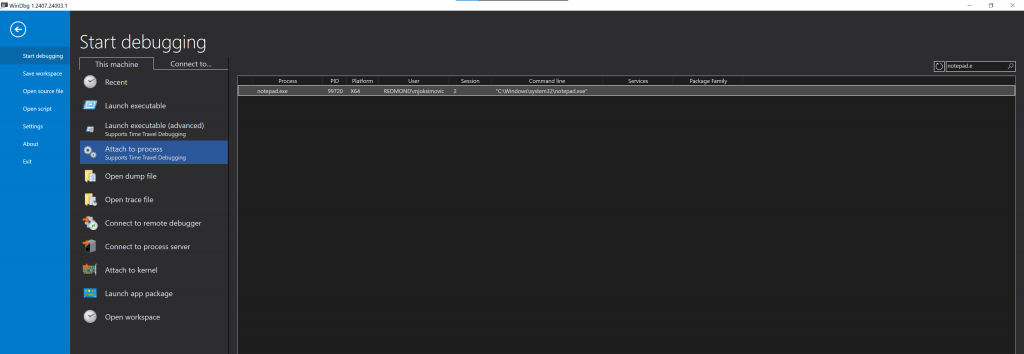
Set-ItemProperty -Path "HKLM:\SOFTWARE\Microsoft\Windows NT\CurrentVersion\Image File Execution Options\notepad.exe" -Name "Debugger" -Value 'C:\Debuggers\WinDbgNext\drop\WinDbgX.exe -c "~* n; .detach; q"'What will happen in this case is that debugger will start the process, increase suspend counter for all threads (that’s what ~* n is for), detach from process and quit the debugger. Now all you need to do is fire up your favorite debugger and attach to the process as regularly. That’s about it 🙂
Lastly, you could use the “-server” option and set up a listener, like so:
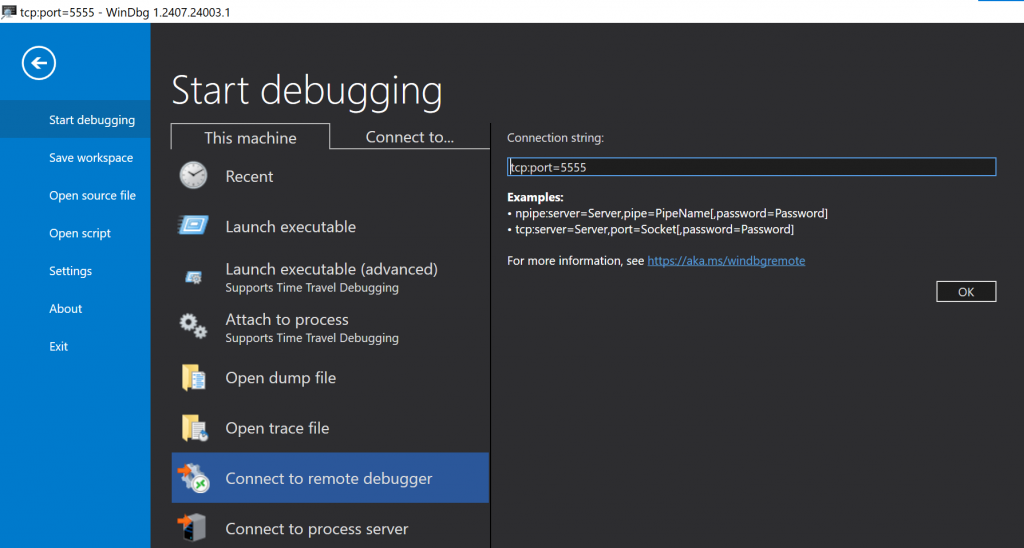
Set-ItemProperty -Path "HKLM:\SOFTWARE\Microsoft\Windows NT\CurrentVersion\Image File Execution Options\notepad.exe" -Name "Debugger" -Value 'C:\Debuggers\cdb.exe -server tcp:port=5555'Now all you need to do is use “Attach to remote Debugger” and specify tcp:port=5555 and you’re good to go:
Why (and how) this works?
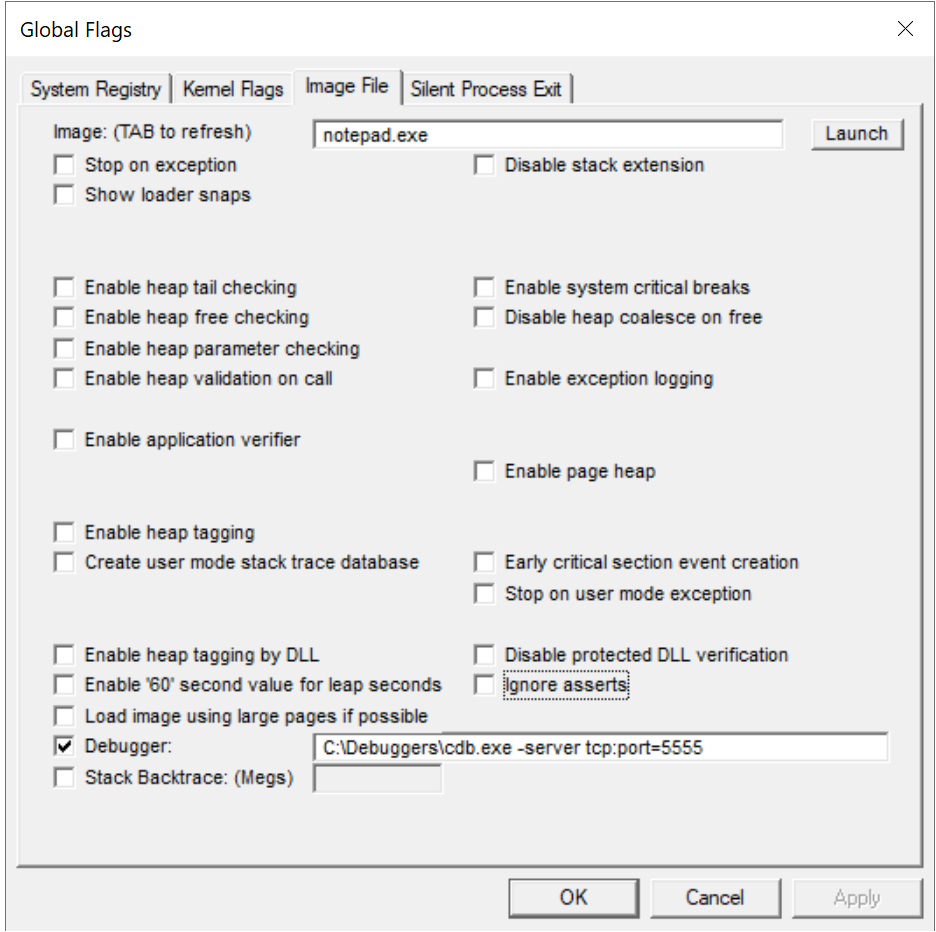
Windows has this nifty feature called Image File Execution Options (IFEO). IFEO enables you to tweak various options, and one of them is the ability to specify a debugger that will be launched when an image with specific name is started. As simple as that really. And it’s actually the exact same thing that GFlags does:
You can really think about this as Windows’ way of helping you attach to process the moment that it starts.
Amusingly enough, what really happens under the hood is the moment you start a process (e.g. notepad.exe), Windows checks if there’s a “Debugger” set for it in HKLM:\SOFTWARE\Microsoft\Windows NT\CurrentVersion\Image File Execution Options\notepad.exe\Debugger. If Debugger is set, what actually happens is that Windows invokes your debugger (cdb.exe in this case) and passes the full path to notepad.exe to it. Hence, what essentially happens is that you start notepad.exe, and under the hood the following executes: C:\Debuggers\cdb.exe -server tcp:port=5555 C:\Windows\System32\notepad.exe.
Hence, your process is actually started by debugger and that’s why you get a chance to start debugging from the very first moment. Quite cool 🙂 Oh, and if you find this interesting, do check out the part 5 of my “how to do debugger stuff” series where I toyed with the idea of writing my own “debugger”.
Does this work with Managed Code as well?
Yes. But I’d suggest you use Visual Studion instead of WinDbg, simply because it’s easier.
So what you’d do is simply:
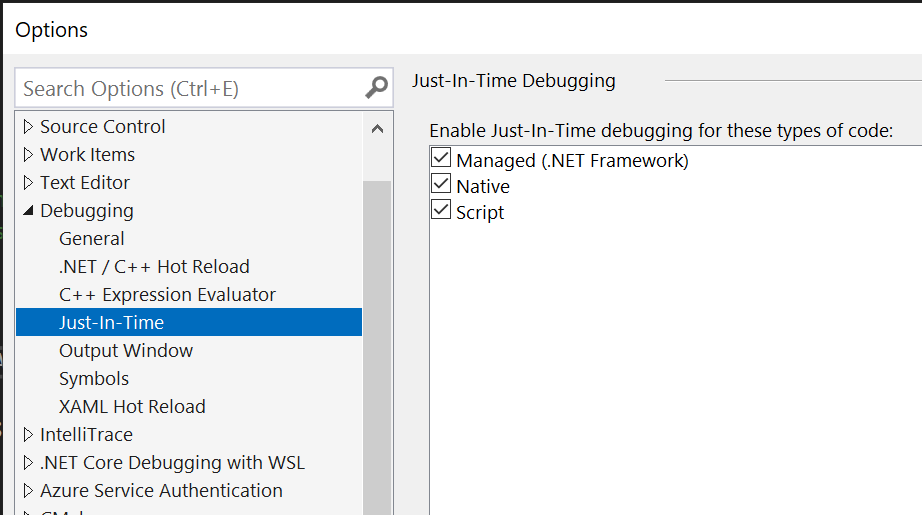
Set-ItemProperty -Path "HKLM:\SOFTWARE\Microsoft\Windows NT\CurrentVersion\Image File Execution Options\notepad.exe" -Name "Debugger" -Value 'C:\Windows\System32\vsjitdebugger.exe'Just make sure your Visual Studio is properly configured for JIT Debugging:
That’s about it for today. Hope you enjoyed it 🙂
Hi Mihailo,
thanks for a helpful post.
I have a question about the -c “~* n; .detach; q” method.
I have the msvsmon running on the remote machine, the app is caught by windbg & is frozen.
I manage to connect to it from VS2022, I see my breakpoints but nothing happens (I can’t do Continue
It looks like although the VS connected to the remote app, it didn’t unfreeze its threads.
Do I need to do some extra step for that?
Regards,
George
Hi George,
Sadly, what you are trying to do is not supported (at least from what I saw). It’s not supported because, at least at the time when I tested, was that VS was not able to “Resume” threads. Please do note that FREEZE/UNFREEZE of threads is actually DIFFERENT than Suspend / Resume 🙂 Hence, you are trying to UNFREEZE something that is SUSPENDED, and that doesn’t work and your stuff keeps being frozen.
Anyway, my advice would be to either try using WinDbg for further debugging (because WinDbg can RESUME the threads that it suspended) or to see if you can use Visual Studio from the very beginning (I never tried it with Remote Debugging to be honest so I’m not 100% sure).